
Page 38 - 19BAR0006
P. 38
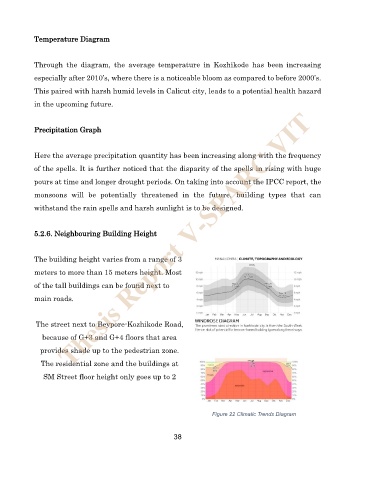
Temperature Diagram


            Through  the  diagram,  the  average  temperature  in  Kozhikode  has  been  increasing

            especially after 2010’s, where there is a noticeable bloom as compared to before 2000’s.

            This paired with harsh humid levels in Calicut city, leads to a potential health hazard
            in the upcoming future.

                        Thesis Report V-SPARC VIT

            Precipitation Graph


            Here the average precipitation quantity has been increasing along with the frequency

            of the spells. It is further noticed that the disparity of the spells in rising with huge
            pours at time and longer drought periods. On taking into account the IPCC report, the

            monsoons  will  be  potentially  threatened  in  the  future,  building  types  that  can

            withstand the rain spells and harsh sunlight is to be designed.


            5.2.6. Neighbouring Building Height


            The building height varies from a range of 3

            meters to more than 15 meters height. Most

            of the tall buildings can be found next to

            main roads.


             The street next to Beypore-Kozhikode Road,

               because of G+3 and G+4 floors that area
              provides shade up to the pedestrian zone.

               The residential zone and the buildings at

               SM Street floor height only goes up to 2


                                                                       Figure 22 Climatic Trends Diagram


                                                          38